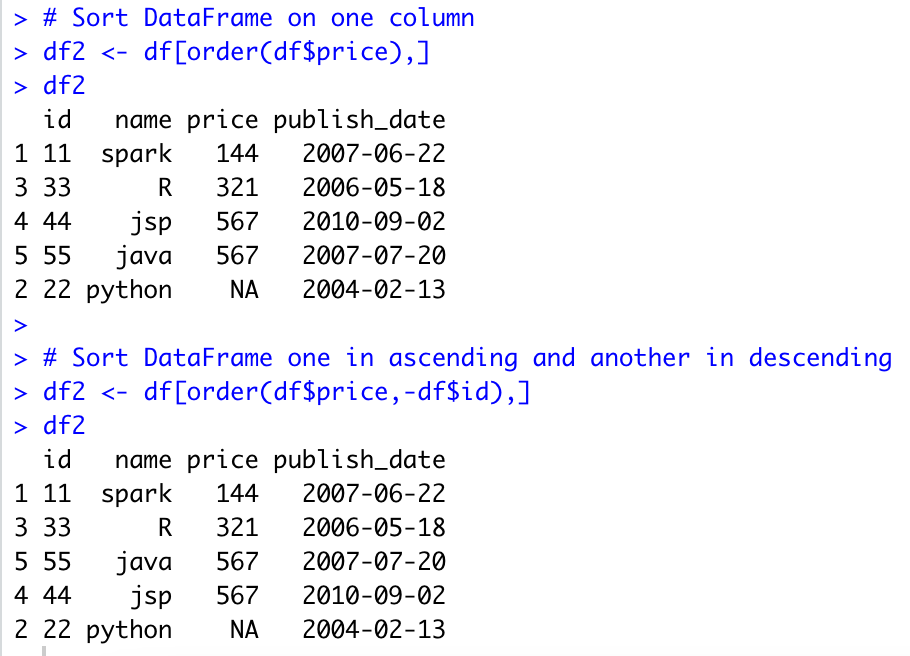
Ever felt overwhelmed by a dataset that seemed to be in utter chaos? Imagine a spreadsheet with customer names scattered randomly, sales figures all mixed up, and product categories in a jumbled mess. Data like this is practically unusable! That’s where the power of arranging your data comes in, and in the world of R programming, the arrange() function from the dplyr package is your ultimate weapon for order.

Image: sparkbyexamples.com
If you’re working with data in R, mastering arrange() is a crucial step towards making sense of your insights and drawing meaningful conclusions. This guide dives deep into the intricacies of arrange(), exploring its functionalities, providing practical examples, and empowering you to organize your data like a true data ninja.
The Power of Order: Why and How arrange() Reshapes Your Data
At its core, arrange() is a function in the dplyr package – a cornerstone of R’s data manipulation capabilities. Its purpose is simple yet profound: to rearrange the rows of your data frame based on the values in one or more columns. Think of it like sorting a physical deck of cards, except with your digital data.
Why Does Order Matter?
Let’s face it, data is rarely presented in a way that’s immediately insightful. Imagine you’re analyzing customer data, with columns for customer ID, purchase amount, and purchase date. To identify your top spenders, you need to sort by purchase amount, putting the biggest spenders at the top! This is where arrange() truly shines. Without it, you’d be sifting through endless rows, squinting at numbers, and probably getting a migraine.
Beyond Sorting: A Versatile Tool
arrange() is more than just a simple sorting mechanism. It allows you to:
- Sort ascending or descending: Need to find the lowest performing products? Sort by sales in descending order.
- Sort by multiple columns: Want to sort by product category first, then by sales?
arrange()lets you apply multiple sorting criteria. - Handle missing values: It can intelligently handle cases where data is missing, ensuring a logical ordering even in the face of incomplete data.
![Statistical [R]ecipes: cowplot: arrange ggplot2 figures in a grid](https://2.bp.blogspot.com/-6a3bRwbRB1k/VbowfMpETbI/AAAAAAAAEPQ/2DV39iz2TSk/s1600/figure1.jpeg)
Image: statisticalrecipes.blogspot.com
Mastering arrange(): A Comprehensive Guide
Now let’s dive into the practical details of using arrange() to your advantage.
The Basic Structure
The syntax of arrange() is incredibly straightforward:
arrange(data_frame, column1, column2, ...)Here:
data_frame: The name of your data frame containing the data you want to arrange.column1,column2, etc.: The names of the columns you want to use for sorting.
Sorting in Ascending Order
To sort in ascending order (from smallest to largest), simply use the column name in the arrange() function:
# Assuming your data frame is called 'sales'
arranged_sales <- arrange(sales, sales_amount)
This will arrange the rows of the sales data frame based on the values in the sales_amount column, putting the lowest sales amounts at the top.
Sorting in Descending Order
For descending order (largest to smallest), use the desc() function:
arranged_sales <- arrange(sales, desc(sales_amount))Now the rows will be ordered with the highest sales amounts appearing first.
Sorting by Multiple Columns
To sort by multiple columns, simply provide the column names in the arrange() function, separating them with commas.
arranged_sales <- arrange(sales, product_category, desc(sales_amount))This will first sort by product_category (alphabetically), and within each category, the sales will be sorted in descending order.
Handling Missing Values
By default, missing values (NA) are treated as the smallest value, making them appear at the beginning of the sorted data frame. If you want to change this behavior, you can use the na.rm argument:
arranged_sales <- arrange(sales, sales_amount, na.rm = TRUE)This will place missing values at the end of the sorted sales_amount, instead of the beginning.
Real-World Examples: Unlocking Insights with arrange()
Let’s illustrate the power of arrange() with practical examples:
Customer Segmentation
Imagine you’re working with customer data, aiming to find your most valuable customers. You can use arrange() to sort by total purchase amount, revealing those who have contributed the most to your revenue:
# Assuming your data frame is called 'customers'
most_valuable_customers <- arrange(customers, desc(total_purchase_amount))
Product Performance Analysis
Do you want to identify your best-selling products? Sorting your sales data by sales volume will reveal your top performers:
best_sellers <- arrange(sales, desc(quantity_sold))Identifying Trends
Suppose you’re analyzing website traffic data. You can use arrange() to identify the highest traffic days or the most popular pages on your website, helping you understand user behavior and optimize content.
Expert Insights: Maximizing Data Organization with arrange()
R expert and data visualization guru, Hadley Wickham, the creator of the dplyr package, emphasizes the importance of clear data organization: “Well-structured data is like a well-organized toolbox – you can easily find the tools you need to get the job done!”
Wickham also stresses that arrange() is best used in conjunction with other dplyr functions, such as filter(), mutate(), and summarize(), to streamline your data analysis processes.
Actionable Tips to Level-Up Your Data Analysis
- Start with a clear goal: Before arranging, define the insights you want to extract from your data.
- Experiment with different sorting criteria: Explore various combinations of columns and sorting orders to discover the most relevant information.
- Visualize your data: Once arranged, consider creating visualizations such as bar charts or line graphs to gain deeper insights from your ordered data.
Arrange In R
Conclusion: Unlock the Power of Order in Your Data
arrange() is a fundamental tool in the R arsenal, empowering you to transform chaotic data into clear, actionable insights. By mastering its functionality, you’ll unlock the potential to analyze data effectively, make data-driven decisions, and gain a competitive edge in your field.
So, go forth and conquer the world of data with the help of arrange(). It’s time to bring order to your data and extract the meaningful stories your data holds!


