Imagine you’re analyzing a dataset of customer information for an online store. You’re interested in exploring the relationship between customer age and purchase frequency. You notice that younger customers tend to make more frequent purchases. But how do you quantify this relationship? This is where the concepts of marginal and conditional distributions come into play.

Image: www.youtube.com
These distributions, key tools in probability and statistics, provide a framework for understanding how variables interact within a dataset. In this article, we’ll delve deeper into the concepts of marginal and conditional distributions, exploring their definitions, applications, and how they can be used for data analysis.
Diving into Probabilities: Marginal and Conditional Distributions
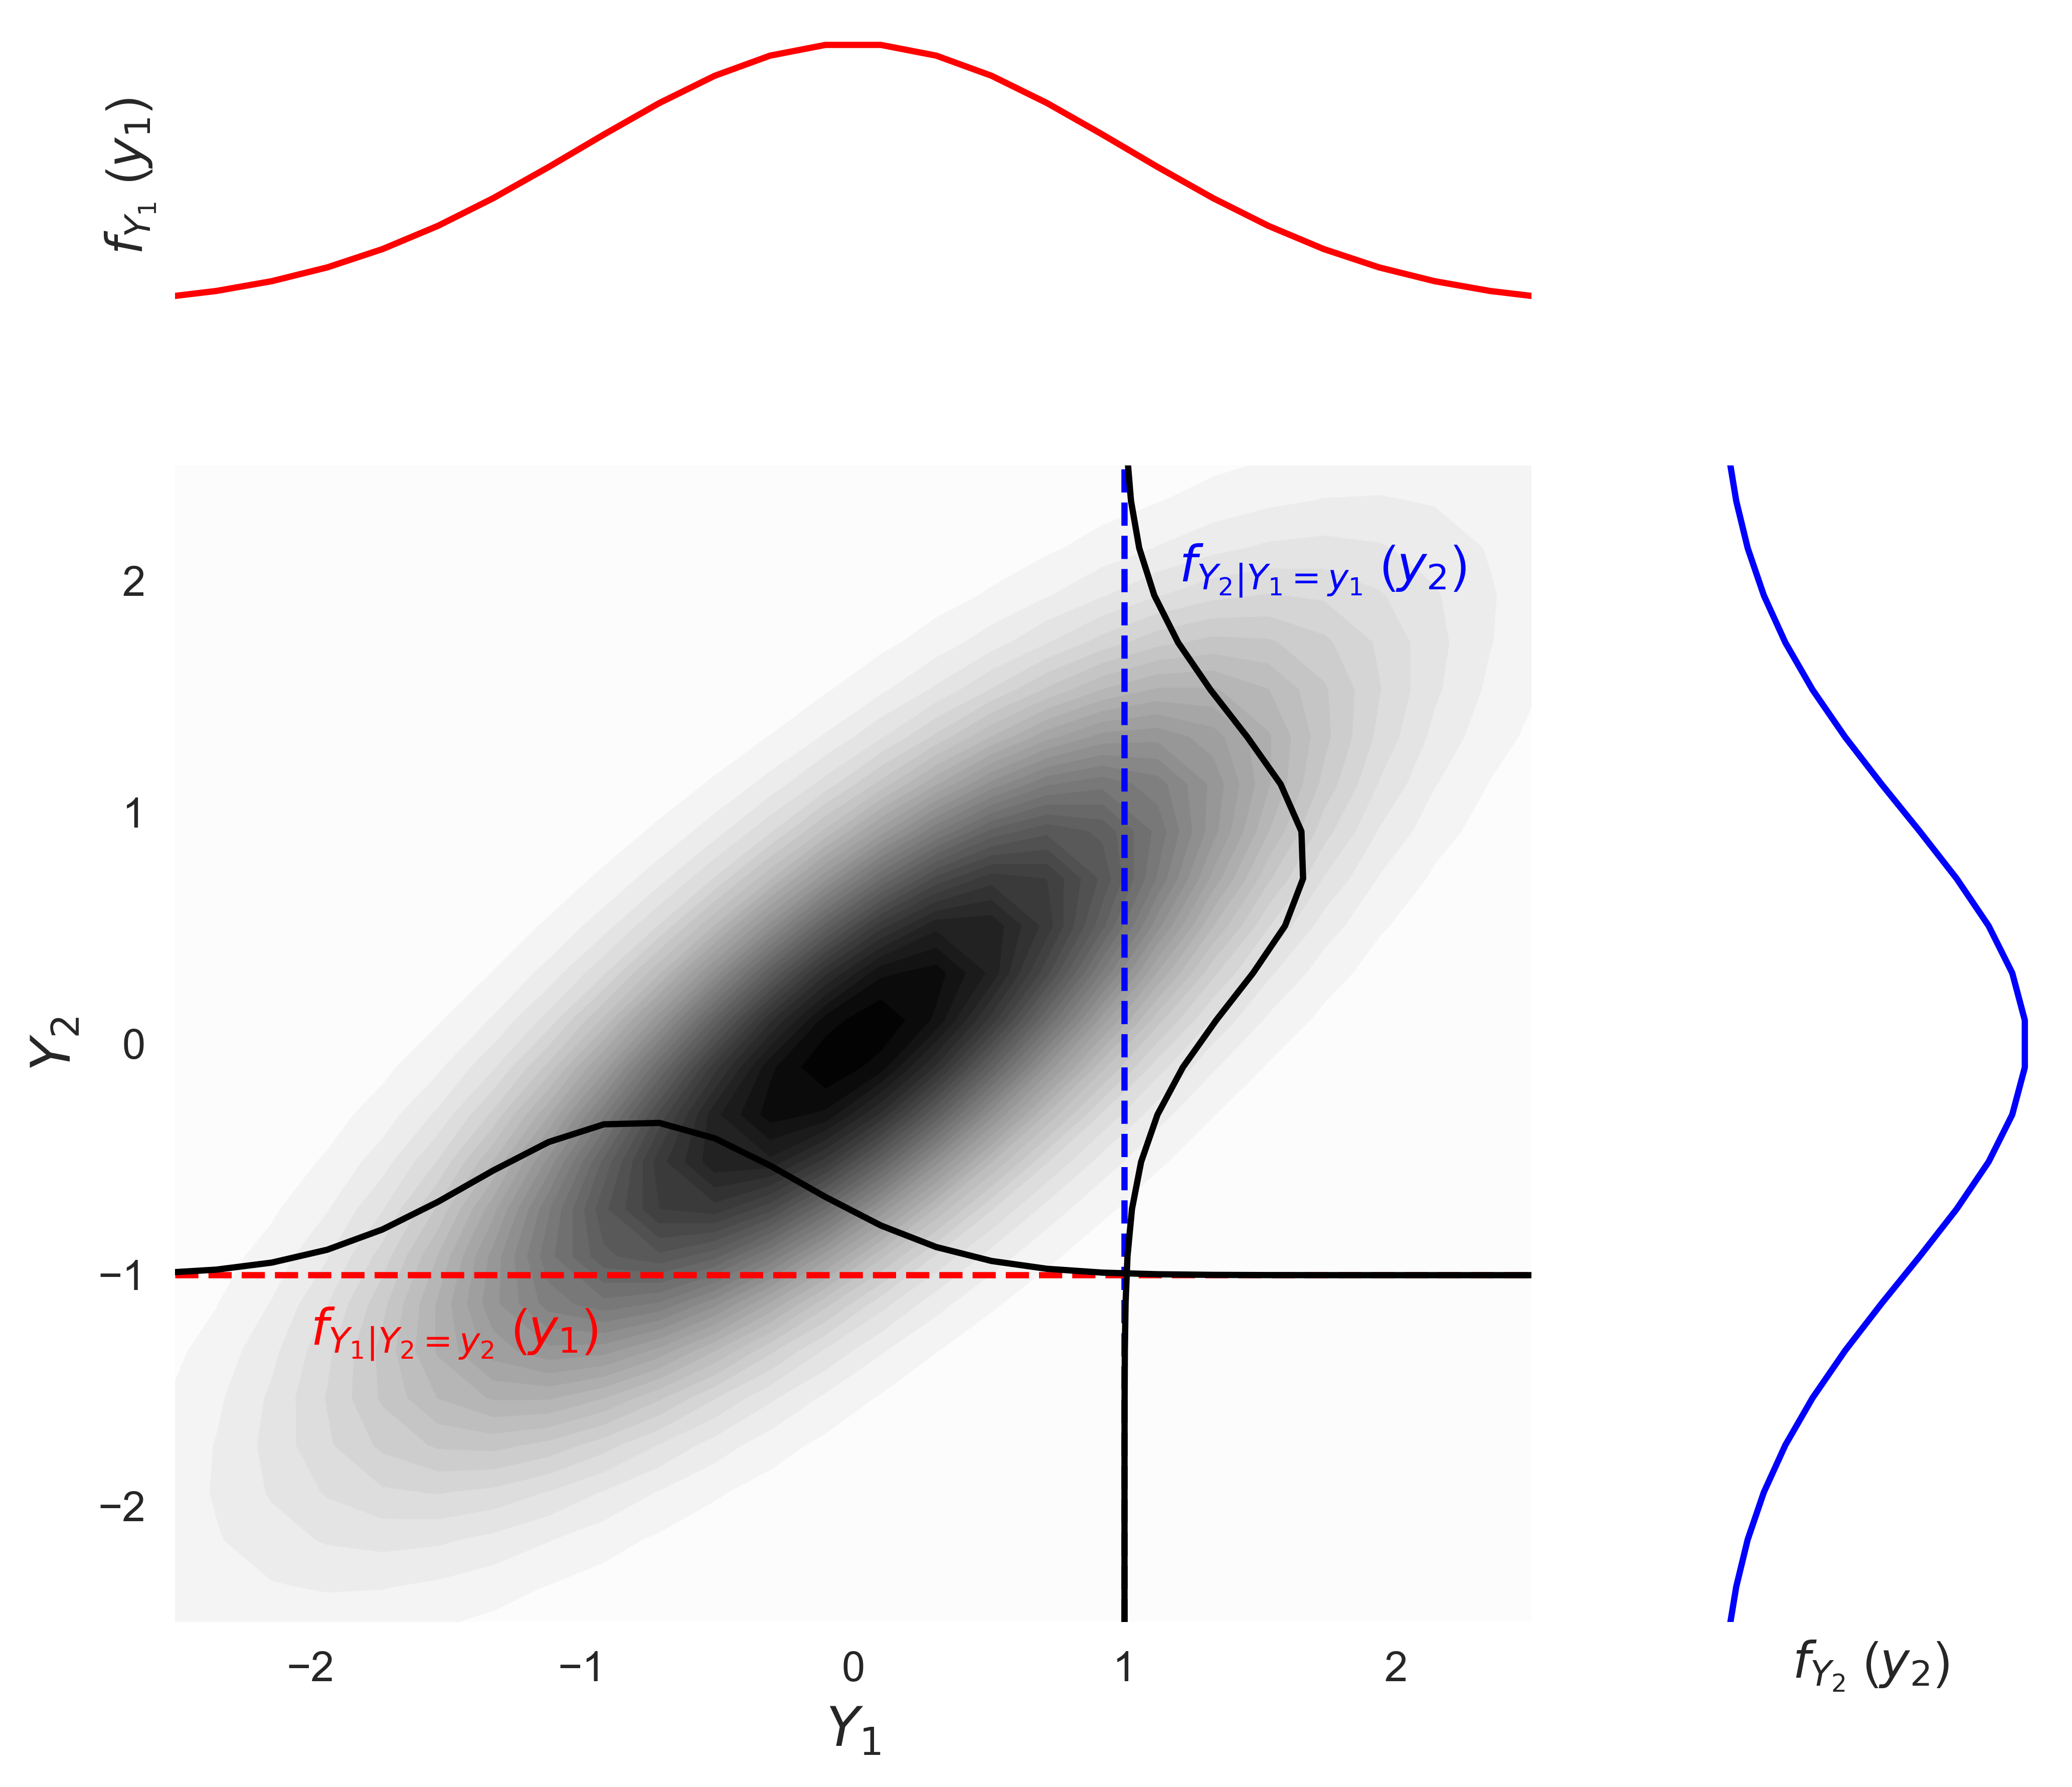
To understand these distributions, let’s start with the basics. In probability, a marginal distribution represents the probability of an event occurring without considering any other event. It focuses on a single variable in a dataset, ignoring the influence of other variables.
On the other hand, a conditional distribution explores the probability of an event happening given that another event has already occurred. It investigates the relationship between variables, considering the influence of one variable on the other.
Understanding Marginal Distributions
Let’s revisit our online store example. Suppose we want to find the marginal distribution of customer age. We’d analyze the distribution of ages within the dataset, regardless of their purchase frequency. This distribution would show us the proportion of customers in different age groups.
This distribution tells us how likely it is to observe a customer within a specific age range, without considering their purchase behavior. It represents the probability distribution of the age variable alone.
Unveiling the Conditional Distribution
Now, let’s examine the conditional distribution of purchase frequency given customer age. In this case, we are interested in the probability of a customer making a certain number of purchases, given their age. For example, we could ask: “What is the probability of a customer aged 25 to 35 making more than 5 purchases in a month?”
This type of distribution allows us to analyze how purchase frequency varies across different age groups. We can understand if younger customers tend to make more frequent purchases or whether there are specific age groups with higher purchase rates.

Image: geostatisticslessons.com
Visualizing and Interpreting Marginal and Conditional Distributions
To understand these concepts visually, we can use various visualizations, such as histograms, bar charts, and scatter plots. For instance, we can create a histogram to represent the marginal distribution of customer age, showing the frequency of each age group.
To visualize a conditional distribution, we can use a scatter plot where the x-axis represents customer age, and the y-axis represents purchase frequency. We can then color-code the points based on different age groups. This helps us see how purchase frequency varies within each age group. Another visualization method is to create a bar chart comparing the purchase frequencies across different age groups.
Applications in Data Analysis
Understanding marginal and conditional distributions is crucial in various data analysis applications, including:
- Market research: Analyzing demographics and consumer behavior to understand market trends and preferences.
- Predictive modeling: Building models to predict future outcomes based on relationships between variables.
- Risk assessment: Identifying risk factors and assessing probabilities of specific events occurring.
- Statistical inference: Drawing conclusions about populations based on sample data and using hypothesis testing.
Key Considerations and Expert Advice
While these distributions are essential tools for data scientists, it’s important to remember some key considerations:
1. Understanding the relationship between variables: It’s important to understand if there is a dependent relationship between variables. If one variable influences the other, a conditional distribution offers insightful information about the relationship between them.
2. Independence of variables: If variables are independent, then the marginal distribution of one variable will not change when considering the value of another variable. In this case, the conditional distribution will be the same as the marginal distribution for that variable.
3. Real-world applications: Remember that these concepts apply to real-world situations, like customer segmentation in marketing, predicting disease risk in healthcare, and understanding financial trends in economics.
FAQs on Marginal and Conditional Distributions
1. What is the main difference between marginal and conditional distributions?
The key difference is that the marginal distribution considers a single variable’s probability without considering any other variable’s influence, while the conditional distribution explores the probability of an event happening given that another event has already occurred, considering the relationship between them.
2. Can I convert a marginal distribution into a conditional distribution?
No, you cannot directly convert a marginal distribution into a conditional distribution. A conditional distribution requires information about the relationship between variables, while a marginal distribution considers only a single variable.
3. Are these distributions always necessary for data analysis?
While not always necessary, understanding these distributions can significantly enhance your analysis, especially when working with complex datasets and exploring relationships between variables.
Marginal Versus Conditional Distribution
Conclusion
We’ve explored the definitions, applications, and key considerations of marginal and conditional distributions. By understanding these concepts, you can gain deeper insights into data and its relationships. Remember, these distributions are powerful tools for understanding data and making informed decisions based on relationships and probabilities.
Are you interested in learning more about how these distributions can be applied in your specific field?


